 Data Guard properties more details:


$ dgmgrl [-silent | -echo] [username/password[@connect_identifier] [dgmgrl_command]]
$ dgmgrl  /
$ dgmgrl sys/pwd
$ dgmgrl sys/pwd@oltp
$ dgmgrl sys/test@dgprimary "show database 'prod'"

$ dgmgrl -logfile observer.log / "stop observer"
$ dgmgrl -silent sys/test@dgprimary "show configuration verbose"
$ dgmgrl  / "show configuration verbose"

=============
ADD - Adds a standby database to the broker configuration.
DGMGRL> ADD DATABASE db_name [AS CONNECT IDENTIFIER IS conn_identifier] [MAINTAINED AS {PHYSICAL|LOGICAL}];
DGMGRL> ADD DATABASE 'testdb' AS CONNECT IDENTIFIER IS testdb MAINTAINED AS PHYSICAL;
DGMGRL> ADD DATABASE 'logdb' AS CONNECT IDENTIFIER IS logdb MAINTAINED AS LOGICAL;
DGMGRL> ADD DATABASE 'devdb' AS CONNECT IDENTIFIER IS devdb.foo.com;

=============
CONNECT - Connects to an Oracle database instance.
DGMGRL> CONNECT username/password[@connect_identifier]
DGMGRL> CONNECT /
DGMGRL> CONNECT sys;
DGMGRL> CONNECT sys@test;
DGMGRL> CONNECT sys/pwd;
DGMGRL> CONNECT sys/pwd@dwh;
DGMGRL> CONNECT /@dwh;
$dgmgrl connect sys

=============
CONVERT - Converts a database from one type to another (from Oracle 11g).
DGMGRL> CONVERT DATABASE database_name TO {SNAPSHOT STANDBY|PHYSICAL STANDBY};
DGMGRL> CONVERT DATABASE 'devdb' to SNAPSHOT STANDBY;
DGMGRL> CONVERT DATABASE 'devdb' to PHYSICAL STANDBY;

=============
CREATE - Creates a broker configuration.
DGMGRL> CREATE CONFIGURATION config_name AS PRIMARY DATABASE IS db_name CONNECT IDENTIFIER IS conn_ident;
DGMGRL> CREATE CONFIGURATION 'dg' AS PRIMARY DATABASE IS 'prod' CONNECT IDENTIFIER IS prod.foo.com;
DGMGRL> CREATE CONFIGURATION 'dg_test' AS PRIMARY DATABASE IS 'test' CONNECT IDENTIFIER IS test;

=============
DISABLE - Disables a configuration, a database, or fast-start failover (FSFO).
DGMGRL> DISABLE CONFIGURATION;
DGMGRL> DISABLE CONFIGURATION;


DGMGRL> DISABLE DATABASE database_name;
DGMGRL> DISABLE DATABASE 'devdb';


DGMGRL> DISABLE FAST_START FAILOVER [FORCE | CONDITION condition];
DGMGRL> DISABLE FAST_START FAILOVER;
DGMGRL> DISABLE FAST_START FAILOVER FORCE;
DGMGRL> DISABLE FAST_START FAILOVER CONDITION '1578';

=============
EDIT - Edits a configuration, database, or instance.
DGMGRL> EDIT CONFIGURATION SET PROTECTION MODE AS {MaxProtection|MaxAvailability|MaxPerformance};
DGMGRL> EDIT CONFIGURATION SET PROTECTION MODE AS MAXPROTECTION;
DGMGRL> EDIT CONFIGURATION SET PROTECTION MODE AS MAXAVAILABILITY;
DGMGRL> EDIT CONFIGURATION SET PROTECTION MODE AS MAXPERFORMANCE;


DGMGRL> EDIT CONFIGURATION SET PROPERTY property_name = value;
DGMGRL> EDIT CONFIGURATION SET PROPERTY FastStartFailoverThreshold = 45;
DGMGRL> EDIT CONFIGURATION SET PROPERTY FastStartFailoverAutoReinstate = FALSE;
DGMGRL> EDIT CONFIGURATION SET PROPERTY FastStartFailoverAutoReinstate = TRUE;
DGMGRL> EDIT CONFIGURATION SET PROPERTY BYSTANDERSFOLLOWROLECHANGE= 'NONE';


DGMGRL> EDIT DATABASE database_name SET PROPERTY property_name = value;
DGMGRL> EDIT DATABASE devdb SET PROPERTY 'LogArchiveFormat'='log_%t_%s_%r_%d.arc';
DGMGRL> EDIT DATABASE prodb SET PROPERTY LogXptMode=SYNC;
DGMGRL> EDIT DATABASE prodb SET PROPERTY LogXptMode=ASYNC;
DGMGRL> EDIT DATABASE prodb SET PROPERTY LogXptMode=ARCH;
DGMGRL> EDIT DATABASE devdb SET PROPERTY LogShipping=OFF;
DGMGRL> EDIT DATABASE devdb SET PROPERTY LogShipping=ON;
DGMGRL> EDIT DATABASE prodb SET PROPERTY LogArchiveTrace=8;
DGMGRL> EDIT DATABASE prodb SET PROPERTY NetTimeout=60;
DGMGRL> EDIT DATABASE devdb SET PROPERTY 'ReopenSecs'=300;
DGMGRL> EDIT DATABASE prodb SET PROPERTY ArchiveLagTarget=1200;
DGMGRL> EDIT DATABASE prodb SET PROPERTY FastStartFailoverTarget='standby_name';
DGMGRL> EDIT DATABASE devdb SET PROPERTY 'StandbyArchiveLocation'='/oradata/archive/';
DGMGRL> EDIT DATABASE devdb SET PROPERTY 'DbFileNameConvert' = '/u01/od01/datafile/, /oradisk/od01/datafile/';
DGMGRL> EDIT DATABASE testdb SET PROPERTY DelayMins='720';
DGMGRL> EDIT DATABASE prodb SET PROPERTY RedoCompression ='ENABLE'
DGMGRL> EDIT DATABASE prodb SET PROPERTY RedoCompression ='DISABLE'
DGMGRL> EDIT DATABASE testdb SET PROPERTY LogArchiveMinSucceedDest =1


DGMGRL> EDIT DATABASE database_name RENAME TO new database_name;
DGMGRL> EDIT DATABASE 'devdbb' RENAME TO 'devdb';


DGMGRL> EDIT DATABASE database_name SET STATE = state [WITH APPLY INSTANCE = instance_name];
DGMGRL> EDIT DATABASE devdb SET STATE='READ-ONLY';
DGMGRL> EDIT DATABASE devdb SET STATE='OFFLINE';
DGMGRL> EDIT DATABASE devdb SET STATE='APPLY-OFF';
DGMGRL> EDIT DATABASE devdb SET STATE='APPLY-ON';
DGMGRL> EDIT DATABASE devdb SET STATE='TRANSPORT-OFF';
DGMGRL> EDIT DATABASE devdb SET STATE='TRANSPORT-ON';
DGMGRL> EDIT DATABASE prodb SET STATE='LOG-TRANSPORT-OFF';
DGMGRL> EDIT DATABASE devdb SET STATE='ONLINE' WITH APPLY INSTANCE=devdb2;


DGMGRL> EDIT INSTANCE instance_name [ON DATABASE database_name] SET AUTO PFILE [={init_file_path|OFF}];
DGMGRL> EDIT INSTANCE 'devdb1' ON DATABASE 'devdb' SET AUTO PFILE='initdevdb1.ora';

DGMGRL> EDIT INSTANCE instance_name [ON DATABASE database_name] SET PROPERTY property_name = value;
DGMGRL> EDIT INSTANCE * ON DATABASE database_name SET PROPERTY property_name = value;
DGMGRL> EDIT INSTANCE 'proddb' ON DATABASE 'proddb' SET PROPERTY 'StandbyArchiveLocation'='/oradata/arch/';

=============
ENABLE - Enables a configuration, a database, or fast-start failover (FSFO).
DGMGRL> ENABLE CONFIGURATION;
DGMGRL> ENABLE CONFIGURATION;


DGMGRL> ENABLE DATABASE database_name;
DGMGRL> ENABLE DATABASE 'devdb';


DGMGRL> ENABLE FAST_START FAILOVER [CONDITION condition];
DGMGRL> ENABLE FAST_START FAILOVER;
DGMGRL> ENABLE FAST_START FAILOVER CONDITION '1578';
DGMGRL> ENABLE FAST_START FAILOVER CONDITION "Stuck Archiver";
DGMGRL> ENABLE FAST_START FAILOVER CONDITION 'Corrupted Controlfile';
DGMGRL> ENABLE FAST_START FAILOVER CONDITION 'Corrupted Dictionary';
DGMGRL> ENABLE FAST_START FAILOVER CONDITION 'Inaccessible Logfile';

=============
EXIT - Exits the program.
DGMGRL> EXIT;

=============
FAILOVER - Changes a standby database to be the primary database.
DGMGRL> FAILOVER TO standby_database_name [IMMEDIATE]
DGMGRL> FAILOVER TO "testdb";
DGMGRL> FAILOVER TO "snapdb" IMMEDIATE;

=============
HELP - Displays description and syntax for a command.
DGMGRL> HELP [command];
DGMGRL> HELP REINSTATE
DGMGRL> HELP EDIT

=============
QUIT - Exits the program.
DGMGRL> QUIT;

=============
REINSTATE - Changes a database marked for reinstatement into a viable standby.
DGMGRL> REINSTATE DATABASE database_name;
DGMGRL> REINSTATE DATABASE prim1;

=============
REM - Comment to be ignored by DGMGRL.
DGMGRL> REM [comment];

=============
REMOVE - Removes a configuration, Oracle database, or instance.
DGMGRL> REMOVE CONFIGURATION [PRESERVE DESTINATIONS];
DGMGRL> REMOVE CONFIGURATION;
DGMGRL> REMOVE CONFIGURATION PRESERVE DESTINATIONS;


DGMGRL> REMOVE DATABASE database_name [PRESERVE DESTINATIONS];
DGMGRL> REMOVE DATABASE devdb;
DGMGRL> REMOVE DATABASE standby PRESERVE DESTINATIONS;


DGMGRL> REMOVE INSTANCE instance_name [ON DATABASE database_name];
DGMGRL> REMOVE INSTANCE inst1 ON DATABASE racdb;

=============
SHOW - Displays information about a configuration, database, instance or FSFO.
DGMGRL> SHOW CONFIGURATION [VERBOSE];
DGMGRL> SHOW CONFIGURATION;
DGMGRL> SHOW CONFIGURATION VERBOSE;


DGMGRL> SHOW DATABASE [VERBOSE] db_name [property_name];
DGMGRL> SHOW DATABASE 'devdb';
DGMGRL> SHOW DATABASE VERBOSE 'test';
DGMGRL> SHOW DATABASE 'dwhdb' 'StatusReport';
DGMGRL> SHOW DATABASE 'proddb' 'LogXptStatus';
DGMGRL> SHOW DATABASE 'proddb' 'InconsistentProperties';
DGMGRL> SHOW DATABASE 'proddb' 'InconsistentLogXptProps';
DGMGRL> SHOW DATABASE 'testdb' 'ArchiveLagTarget';
DGMGRL> SHOW DATABASE 'testdb' 'LogShipping';
DGMGRL> SHOW DATABASE 'testdb' 'PreferredApplyInstance';
DGMGRL> SHOW DATABASE 'proddb' 'StatusReport';
DGMGRL> SHOW DATABASE 'testdb' 'RecvQEntries';
DGMGRL> SHOW DATABASE 'proddb' 'SendQEntries';


DGMGRL> SHOW INSTANCE [VERBOSE] instance_name [property_name] [ON DATABASE db_name];
DGMGRL> SHOW INSTANCE inst1;
DGMGRL> SHOW INSTANCE VERBOSE inst3;
DGMGRL> SHOW INSTANCE testdb 'TopWaitEvents';


DGMGRL> SHOW FAST_START FAILOVER;
DGMGRL> SHOW FAST_START FAILOVER;

From 18c Oracle Database, SHOW ALL command shows the values of DGMGRL command line utility properties.
DGMGRL> SHOW ALL;
   debug ON
   echo OFF
   time OFF
   observerconfigfile = observer.ora

=============
SHUTDOWN - Shuts down a currently running Oracle instance.
DGMGRL> SHUTDOWN [NORMAL
 | IMMEDIATE | ABORT];
DGMGRL> SHUTDOWN;
DGMGRL> SHUTDOWN NORMAL;
DGMGRL> SHUT IMMEDIATE;
DGMGRL> SHUT ABORT;

=============
SQL - Executes a SQL statement
DGMGRL> SQL "sql_statement";


=============
START - Starts the fast-start failover(FSFO) observer.
DGMGRL> START OBSERVER [FILE=observer_configuration_file];
DGMGRL> START OBSERVER;

=============
STARTUP - Starts an Oracle database instance.
DGMGRL> STARTUP [RESTRICT] [FORCE] [PFILE=filespec]
[NOMOUNT  |  MOUNT | OPEN
 [READ ONLY|READ WRITE]];
DGMGRL> STARTUP;
DGMGRL> STARTUP NOMOUNT;
DGMGRL> STARTUP MOUNT;
DGMGRL> STARTUP OPEN;

DGMGRL> STARTUP FORCE;
DGMGRL> STARTUP FORCE RESTRICT NOMOUNT;
DGMGRL> STARTUP PFILE=initdwh.ora NOMOUNT;

=============
STOP - Stops the fast-start failover(FSFO) observer.
DGMGRL> STOP OBSERVER;

=============
SWITCHOVER - Switches roles between a primary and standby database.
DGMGRL> SWITCHOVER TO standby_database_name;
DGMGRL> SWITCHOVER TO "standby";

=============
VALIDATE - command to checks whether the database is ready for a role transition or not.

DGMGRL> VALIDATE DATABASE 'DB_NAME';    -- From Oracle Database 12c


From Oracle Database 18c,
DGMGRL> VALIDATE DATABASE standby-database-name SPFILE;

DGMGRL> VALIDATE NETWORK CONFIGURATION FOR { ALL | member name };
DGMGRL> VALIDATE NETWORK CONFIGURATION FOR stdby;

DGMGRL> VALIDATE STATIC CONNECT IDENTIFIER FOR { ALL | database name };
DGMGRL> VALIDATE STATIC CONNECT IDENTIFIER FOR stdby;


$BDUMP/drc*.log
$ORACLE_HOME/rdbms/log/drc*.log

alter system set dg_broker_start=false;
alter system set dg_broker_start=false sid='*';
alter system set dg_broker_start=FALSE SCOPE=spfile SID='*';
alter system set dg_broker_start=true;
alter system set dg_broker_start=true sid='*';
alter system set dg_broker_start=TRUE SCOPE=spfile SID='*';

alter system set dg_broker_config_file1='/u01/dg_broker_config_files/dr1TESTP.dat' sid='*';
alter system set dg_broker_config_file2='/u01/dg_broker_config_files/dr2TESTP.dat' sid='*';
Category: Oracle Database
Extracting user details
set feedback off pages 0 long 900000 lines 20000 pagesize 20000 serveroutput on
accept USERNAME prompt “Enter username :”
–This line add a semicolon at the end of each statement
execute dbms_METADATA.SET_TRANSFORM_PARAM(DBMS_METADATA.SESSION_TRANSFORM,’SQLTERMINATOR’,true);
— This will generate the DDL for the user and add his objects,system and role grants
SELECT DBMS_METADATA.GET_DDL(‘USER’,username) as script from DBA_USERS where username=’&username’
UNION ALL
SELECT DBMS_METADATA.GET_GRANTED_DDL(‘SYSTEM_GRANT’,grantee)as script from DBA_SYS_PRIVS where grantee=’&username’ and rownum=1
UNION ALL
SELECT DBMS_METADATA.GET_GRANTED_DDL(‘ROLE_GRANT’,grantee)as script from DBA_ROLE_PRIVS where grantee=’&username’ and rownum=1
UNION ALL
SELECT DBMS_METADATA.GET_GRANTED_DDL(‘OBJECT_GRANT’,grantee)as script from DBA_TAB_PRIVS where grantee=’&username’ and rownum=1;
Primary and standby status
We can run following queries to check all are fine with Standby db.
@Primaryset lines 500
column destination format a35 wrap
column process format a7
column archiver format a8
column ID format 99
select dest_id “ID”,destination,status,target,archiver,schedule,process,mountid from v$archive_dest;
Output (Status should return valid for standby destination)
ID DESTINATION STATUS TARGET ARCHIVER SCHEDULE PROCESS MOUNTID
1 /podaai/arch/PODAAI1/ VALID PRIMARY ARCH ACTIVE ARCH 0
2 podaai1_rmdc VALID STANDBY ARCH ACTIVE ARCH 0
3 INACTIVE PRIMARY ARCH INACTIVE ARCH 0
4 INACTIVE PRIMARY ARCH INACTIVE ARCH 0
5 INACTIVE PRIMARY ARCH INACTIVE ARCH 0
6 INACTIVE PRIMARY ARCH INACTIVE ARCH 0
7 INACTIVE PRIMARY ARCH INACTIVE ARCH 0
8 INACTIVE PRIMARY ARCH INACTIVE ARCH 0
9 INACTIVE PRIMARY ARCH INACTIVE ARCH 0
10 INACTIVE PRIMARY ARCH INACTIVE ARCH 0
column error format a55 tru
select dest_id,status,error from v$archive_dest;
Output (Should not return any error messages)
DEST_ID STATUS ERROR
     1 VALID
     2 VALID
     3 INACTIVE
     4 INACTIVE
     5 INACTIVE
     6 INACTIVE
     7 INACTIVE
     8 INACTIVE
     9 INACTIVE
    10 INACTIVE
column message format a80
select message, timestamp from v$dataguard_status where severity in (‘Error’,’Fatal’) order by timestamp;
Output (Should not return any rows)
SCP SYNTAX
scp PGEORI_2_23362*.arc rmohsgeor36.oracleoutsourcing.com:/pgeori/arch/PGEORI1
$ scp PCFITI_1_57371_604994162.arc rmohscfit03.oracleoutsourcing.com:/pcfiti/arch/
PCFITI_1_57371_604994162.arc
@Standbyselect process,status,client_process,sequence#,block#,active_agents,known_agents from v$managed_standby;
Output (Should show MRP process up and running)
PROCESS STATUS CLIENT_P SEQUENCE# BLOCK# ACTIVE_AGENTS KNOWN_AGENTS
ARCH CONNECTED ARCH 0 0 0 0
ARCH CONNECTED ARCH 0 0 0 0
ARCH CONNECTED ARCH 0 0 0 0
ARCH CONNECTED ARCH 0 0 0 0
RFS RECEIVING UNKNOWN 13491 36819 0 0
RFS RECEIVING UNKNOWN 13364 1810 0 0
RFS RECEIVING UNKNOWN 13493 38735 0 0
RFS RECEIVING UNKNOWN 13363 156 0 0
RFS ATTACHED UNKNOWN 13494 36989 0 0
RFS RECEIVING UNKNOWN 0 0 0 0
RFS RECEIVING UNKNOWN 13362 327 0 0
PROCESS STATUS CLIENT_P SEQUENCE# BLOCK# ACTIVE_AGENTS KNOWN_AGENTS
RFS ATTACHED UNKNOWN 13365 165 0 0
RFS RECEIVING UNKNOWN 13492 36686 0 0
MRP0 WAIT_FOR_LOG N/A 13493 0 0 0
column message format a80
select message, timestamp from v$dataguard_status where severity in (‘Error’,’Fatal’) order by timestamp;
Output (Should not return any rows)
Note: If we gets results as shown above, we can close the standby alerts as TFALSE.
Pls correct/ add comments if required.
To determine if there is an archive gap on your physical standby database, query
the as shown in the following example:
break on report
compute sum of GAP on report
select to_char(sysdate,’DD.MM.RR HH24:MI:SS’) time, a.thread#, (select
max(sequence#) from v$archived_log where archived’YES’ and thread#a.thread#)
archived, max(a.sequence#) applied, (select max(sequence#) from v$archived_log
where archived’YES’ and thread#a.thread#)-max(a.sequence#) gap from
v$archived_log a where a.applied’YES’ group by a.thread#;
To verify the log application status.
On primary DB
SELECT THREAD#, MAX(SEQUENCE#) AS “LAST_GENERATED_LOG” FROM V$LOG_HISTORY GROUP BY THREAD#;
Standby DB
SELECT THREAD#, MAX(SEQUENCE#) AS “LAST_APPLIED_LOG” FROM V$LOG_HISTORY GROUP BY THREAD#;
To see the max seq applied.
select THREAD#,max(SEQUENCE#) from v$archived_log where APPLIED’YES’ group by THREAD#;
To stop the MRP.
alter database recover managed standby database cancel;
To start the MRP.
recover managed standby database disconnect from session;
To recover standby manually.
SQL> recover automatic standby database;
SQL> recover managed standby database parallel
a. no. of cpu…
b. no. of thread possible on each cpu…
total threads a*b -1
To enable the in one commmand.
SQL> ALTER SYSTEM SET log_archive_dest_state_2enable scopeboth SID’*’ ;
To start the standby and put in MRP
SQL> startup nomount;
SQL> alter database mount standby database;
recover managed standby database disconnect from session ;
To find the missing logs @ standby
./autofs/cmd_ctr/database/missing_seq.sh
missing_seq.sh Parameter missing: missing_seq.sh low_seq high_seq thread#_if_rac
In case of Non Rac: missing_seq.sh 200 220 No need to give thread#
for Non Rac: missing_seq.sh 200 220 3 Here 3 is the thread#
set pagesize 10000
SELECT A., Round(A.Count#B.AVG#/1024/1024) Daily_Avg_Mb
FROM
(
SELECT thread#,
To_Char(First_Time,’YYYY-MM-DD’) DAY,
Count(1) Count#,
Min(RECID) Min#,
Max(RECID) Max#
FROM
gv$log_history
GROUP BY
thread#, To_Char(First_Time,’YYYY-MM-DD’)
ORDER
BY 2 DESC
) A,
(
SELECT Thread#,
Avg(BYTES) AVG#,
Count(1) Count#,
Max(BYTES) Max_Bytes,
Min(BYTES) Min_Bytes
FROM
gv$log group by thread#
) B where a.thread#b.thread#;
THREAD# DAY COUNT# MIN# MAX# DAILY_AVG_MB
     1 2010-03-24        113     133452     133564        14238
     1 2010-03-23        174     133278     133451        21924
     1 2010-03-22        182     133096     133277        22932
     1 2010-03-21        112     132984     133095        14112
     1 2010-03-20        145     132839     132983        18270
     1 2010-03-19        176     132663     132838        22176
     1 2010-03-18        200     132463     132662        25200
     1 2010-03-17        154     132309     132462        19404
     1 2010-03-16        164     132145     132308        20664
1 2010-03-15 40 132105 132144 5040RAC Shutdown and Startup
to shutdown (in all nodes)
$ srvctl stop database -d <db_unique_name>
$ crsctl stop cluster -all
$ crsctl stop crs -all
to startup (in all nodes)
$ crsctl start crs -all
$ crsctl start cluster -all
$ srvctl start database -d <db_unique_name>
Solaris and AIX: prtconf command
prtconf command for Aix and Solaris operating systems.
It provide the information about below ones:
System model.
Machine serial number.
Processor type, number of processors and clock speed of processors.
Network information.
File system information.
Paging space information.
Devices information.
Total memory size.
To Gather General Machine Information
Using the command prtconf alone provides the whole information of machine.
The sample is given below. Some actual values have been replaced with other values for the sake of security.
ask-sanjay10: $ prtconf
To know what is the LPAR partition number and partition name use -L.
ask-sanjay10: $ prtconf -L
If its not LPAR, then “-1 NULL” will be returned.
To know the physical memory size of the machine use -m flag.
ask-sanjay10: $ prtconf -m
To know the Vital Product Data of all physical devices internal or attached to the machine, use -v option.
ask-sanjay10: $prtconf -v
Almost all of the information gathered by above commands is sn above in the output of prtconf command.
To Get The Processor Clock Speed
For this issue the command with -s parameter.
ask-sanjay10: $ prtconf -s
To Get CPU Type
To know if the cpu type is 32 bit or 64 bit, issue the command with -c parameter.
ask-sanjay10: $ prtconf -c
To Know The Type of Kenel bits
ask-sanjay10: $ prtconf -k
Unix: Performance commands at O.S.
Performance related commands iostat , vmstat
Introduction to iostat , vmstat and netstat
This document is primarily written with reference to solaris performance monitoring and tuning but these tools are available in other unix variants also with slight syntax difference.
iostat , vmstat and netstat are three most commonly used tools for performance monitoring . These comes built in with the operating system and are easy to use .iostat stands for input output statistics and reports statistics for i/o devices such as disk drives . vmstat gives the statistics for virtual Memory and netstat gives the network statstics .
Following paragraphs describes these tools and their usage for performance monitoring.
Table of content :
1. Iostat
* Syntax
* example
* Result and Solutions
2. vmstat
* syntax
* example
* Result and Solutions
3. netstat
* syntax
* example
* Result and Solutions
Input Output statistics ( iostat )
iostat reports terminal and disk I/O activity and CPU utilization. The first line of output is for the time period since boot & each subsequent line is for the prior interval . Kernel maintains a number of counters to keep track of the values.
iostat’s activity class options default to tdc (terminal, disk, and CPU). If any other option/s are specified, this default is completely overridden i.e. iostat -d will report only statistics about the disks.
syntax:
Basic synctax is iostat interval count
option – let you specify the device for which information is needed like disk , cpu or terminal. (-d , -c , -t or -tdc ) . x options gives the extended statistics .
interval – is time period in seconds between two samples . iostat 4 will give data at each 4 seconds interval.
count – is the number of times the data is needed . iostat 4 5 will give data at 4 seconds interval 5 times
Example
$ iostat -xtc 10 5
extended disk statistics tty cpu
disk r/s w/s Kr/s Kw/s wait actv svc_t %w %b tin tout us sy wt id
sd0 2.6 3.0 20.7 22.7 0.1 0.2 59.2 6 19 0 84 3 85 11 0
sd1 4.2 1.0 33.5 8.0 0.0 0.2 47.2 2 23
sd2 0.0 0.0 0.0 0.0 0.0 0.0 0.0 0 0
sd3 10.2 1.6 51.4 12.8 0.1 0.3 31.2 3 31
The fields have the following meanings:
disk name of the disk
r/s reads per second
w/s writes per second
Kr/s kilobytes read per second
Kw/s kilobytes written per second
wait average number of transactions waiting for service (Q length)
actv average number of transactions actively being serviced
(removed from the queue but not yet completed)
%w percent of time there are transactions waiting
for service (queue non-empty)
%b percent of time the disk is busy (transactions
in progress)
Results and Solutions
The values to look from the iostat output are:
* Reads/writes per second (r/s , w/s)
* Percentage busy (%b)
* Service time (svc_t)
If a disk shows consistently high reads/writes along with , the percentage busy (%b) of the disks is greater than 5 percent, and the average service time (svc_t) is greater than 30 milliseconds, then one of the following action needs to be taken
1.) Tune the application to use disk i/o more efficiently by modifying the disk queries and using available cache facilities of application servers .
2.) Spread the file system of the disk on to two or more disk using disk striping feature of volume manager /disksuite etc.
3.) Increase the system parameter values for inode cache , ufs_ninode , which is Number of inodes to be held in memory. Inodes are cached globally (for UFS), not on a per-file system basis
4.) Move the file system to another faster disk /controller or replace existing disk/controller to a faster one.
Virtual Memory Statistics ( vmstat )
vmstat
vmstat reports virtual memory statistics of process, virtual memory, disk, trap, and CPU activity.
On multicpu systems , vmstat averages the number of CPUs into the output. For per-process statistics .Without options, vmstat displays a one-line summary of the virtual memory activity since the system was booted.
syntax
Basic synctax is vmstat interval count
option – let you specify the type of information needed such as paging -p , cache -c ,.interrupt -i etc.
if no option is specified information about process , memory , paging , disk ,interrupts & cpu is displayed .
interval – is time period in seconds between two samples . vmstat 4 will give data at each 4 seconds interval.
count – is the number of times the data is needed . vmstat 4 5 will give data at 4 seconds interval 5 times.
Example
The following command displays a summary of what the system
is doing every five seconds.
# vmstat 5
procs memory page disk faults cpu
r b w swap free re mf pi p fr de sr s0 s1 s2 s3 in sy cs us sy id
0 0 0 11456 4120 1 41 19 1 3 0 2 0 4 0 0 48 112 130 4 14 82
0 0 1 10132 4280 0 4 44 0 0 0 0 0 23 0 0 211 230 144 3 35 62
0 0 1 10132 4616 0 0 20 0 0 0 0 0 19 0 0 150 172 146 3 33 64
0 0 1 10132 5292 0 0 9 0 0 0 0 0 21 0 0 165 105 130 1 21 78
The fields of vmstat’s display are
procs
r in run queue
b blocked for resources I/O, paging etc.
w swapped
memory (in Kbytes)
swap – amount of swap space currently available
free – size of the free list
page ( in units per second).
re page reclaims – see -S option for how this
field is modified.
mf minor faults – see -S option for how this
field is modified.
pi kilobytes paged in
po kilobytes paged out
fr kilobytes freed
de anticipated short-term memory shortfall (Kbytes)
sr pages scanned by clock algorithm
disk ( operations per second )
There are slots for up to four disks,
labeled with a single letter and number.
The letter indicates the type of disk
(s = SCSI, i = IPI, etc).
The number is the logical unit number.
faults
in (non clock) device interrupts
sy system calls
cs CPU context switches
cpu – breakdown of percentage usage of CPU time.
On multiprocessors this is an a
average across all processors.
us user time
sy system time
id idle time
Results and Solution from iostat
A. CPU issues
Following columns has to be watched to determine if there is any cpu issue
1. Processes in the run queue (procs r)
2. User time (cpu us)
3. System time (cpu sy)
4. Idle time (cpu id)
procs cpu
r b w us sy id
0 0 0 4 14 82
0 0 1 3 35 62
0 0 1 3 33 64
0 0 1 1 21 78
Problem symptoms
A.) Number of processes in run queue
1.) If the number of processes in run queue (procs r) are consistently greater than the number of CPUs on the system it will slow down system as there are more processes then available CPUs .
2.) if this number is more than four times the number of available CPUs in the system then system is facing shortage of cpu power and will greatly slow down the processess on the system.
3.) If the idle time (cpu id) is consistently 0 and if the system time (cpu sy) is double the user time (cpu us) system is facing shortage of CPU resources.
Resolution
Resolution to these kind of issues involves tuning of application procedures to make efficient use of cpu and as a last resort increasing the cpu power or adding more cpu to the system.
B. Memory Issues
Memory bottlenecks are determined by the scan rate (sr) . The scan rate is the pages scanned by the clock algorithm per second. If the scan rate (sr) is continuously over 200 pages per second then there is a memory shortage.
Resolution
1. Tune the applications & servers to make efficient use of memory and cache.
2. Increase system memory .
3. Implement priority paging in s in pre solaris 8 versions by adding line “set priority paging=1? in
/etc/system. Remove this line if upgrading from Solaris 7 to 8 & retaining old /etc/system file.
RAC: List all locked objects for all instances in RAC
SET LINESIZE 230
SET PAGESIZE 300
SET VERIFY OFF
COLUMN owner FORMAT A20
COLUMN username FORMAT A20
COLUMN object_owner FORMAT A20
COLUMN object_name FORMAT A30
COLUMN locked_mode FORMAT A15
SELECT b.inst_id,
b.session_id AS sid,
NVL(b.oracle_username, '(oracle)') AS username,
a.owner AS object_owner,
a.object_name,
Decode(b.locked_mode, 0, 'None',
1, 'Null (NULL)',
2, 'Row-S (SS)',
3, 'Row-X (SX)',
4, 'Share (S)',
5, 'S/Row-X (SSX)',
6, 'Exclusive (X)',
b.locked_mode) locked_mode,
b.os_user_name
FROM dba_objects a, gv$locked_object b
WHERE a.object_id = b.object_id
ORDER BY 1, 2, 3, 4; Sample output:
Script which will generate the alter session kill command:select blocking_session,blocked_session,script from
( select distinct
s1.username || '@' || s1.machine || ' ( INST=' || s1.inst_id || ' SID=' || s1.sid || ' ET=' || s1.last_call_et || 'sn. STATUS=' || s1.status || ' EVENT=' || s1.event || ' ACTION= ' || s1.action || ' PROGRAM=' || s1.program || ' MODULE=' || s1.module || ')' blocking_session,
s2.username || '@' || s2.machine || ' ( INST=' || s2.inst_id || ' SID=' || s2.sid || ' ET=' || s2.last_call_et || 'sn. STATUS=' || s2.status || ' EVENT=' || s2.event || ' ACTION= ' || s2.action || ' PROGRAM=' || s2.program || ' MODULE=' || s2.module || ')' blocked_session,
decode(s1.type,'USER','alter system kill session ''' || s1.sid || ',' || s1.serial# || ',@' || s1.inst_id || ''' immediate;' ,null)
script ,
count(*) over (partition by s1.inst_id,s1.sid) blocked_cnt
from gv$lock l1, gv$session s1, gv$lock l2, gv$session s2
where s1.sid=l1.sid and s2.sid=l2.sid
and s1.inst_id=l1.inst_id and s2.inst_id=l2.inst_id
and l1.block > 0 and l2.request > 0
and l1.id1 = l2.id1 and l1.id2 = l2.id2 )
order by blocked_cnt desc;
Finding the SQL_id with other details about the blocking sessions.
 set lines 1234 pages 9999
  col inst_id for a10
  col serial# for a10
  col machine for a30
  col username for a10
  col event for a20
  col blocking_session for 999999
  col blocking_instance for 999999
  col status for a10
  col INST_ID for 9999
  col SERIAL# for 999999
  select inst_id,sid,serial#, machine, username, event, blocking_session, blocking_instance, status, sql_id
  from gv$session where status ='ACTIVE'and username is not null and username!='SYS';
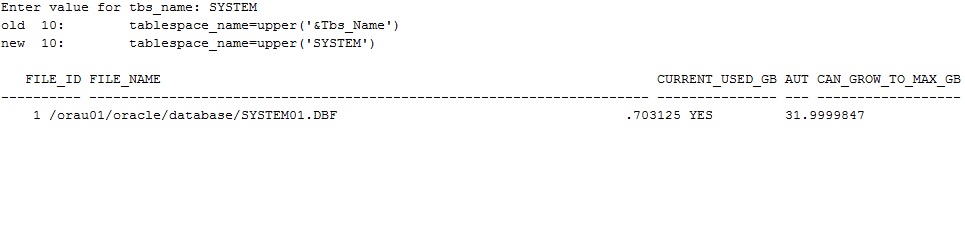
DB Admin: Used, auto and max space of datafile/s of given tablespace in Gb
Given tablespace used, auto and max in GB
set lines 200
set pagesize 150
break on report
compute sum of mbytes on report
col file_name format a70
select
file_id,
file_name,
bytes/1024/1024/1024 CURRENT_USED_GB,
autoextensible,
maxbytes/1024/1024/1024 CAN_GROW_TO_MAX_GB
from
dba_data_files
where
tablespace_name=upper('&Tbs_Name');
Sample output:
Tablespace usage history
Tablespace usage history of 7 days.
select thedate,
gbsize,
prev_gbsize,
gbsize-prev_gbsize diff
from (
select thedate,
gbsize,
lag(gbsize,1) over (order by r) prev_gbsize
from (
select rownum r,
thedate,
gbsize
from (
select trunc(thedate) thedate,
max(gbsize) gbsize
from (
select to_date(to_char(snapshot.begin_interval_time,'YYYY-MON-DD HH24:MI:SS'),'YYYY-MON-DD HH24:MI:SS') thedate,
round((usage.tablespace_usedsize*block_size.value)/1024/1024/1024,2) gbsize
from dba_hist_tbspc_space_usage usage,
v$tablespace tablespace,
dba_hist_snapshot snapshot,
v$parameter block_size
where usage.snap_id = snapshot.snap_id
and usage.tablespace_id = tablespace.ts#
and tablespace.name = '&tablespace'
and block_size.name = 'db_block_size'
)
group by
trunc(thedate)
order by
trunc(thedate)
)
)
);
Enter value for Tablespace: TEMP
Sample Output:
THEDATE GBSIZE PREV_GBSIZE DIFF
——— ———- ———– ———-
15-OCT-15 13.04
16-OCT-15 11.21 13.04 -1.83
17-OCT-15 .91 11.21 -10.3
18-OCT-15 0 .91 -.91
19-OCT-15 6.44 0 6.44
20-OCT-15 4.45 6.44 -1.99
21-OCT-15 15.89 4.45 11.44
22-OCT-15 3.88 15.89 -12.01
8 rows selected.
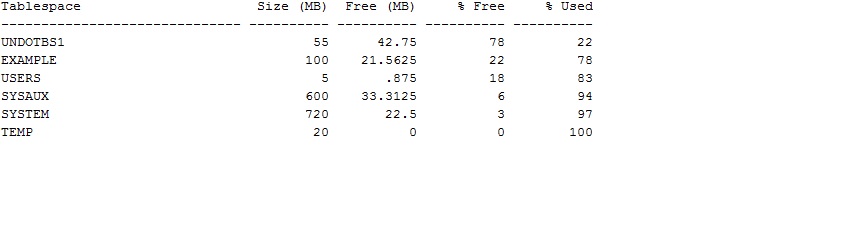
DB Admin: Tablesapces size(MB), free(MB) % used and %free
set pagesize 150
SELECT /* + RULE */ df.tablespace_name "Tablespace",
df.bytes / (1024 * 1024) "Size (MB)",
SUM(fs.bytes) / (1024 * 1024) "Free (MB)",
Nvl(Round(SUM(fs.bytes) * 100 / df.bytes),1) "% Free",
Round((df.bytes - SUM(fs.bytes)) * 100 / df.bytes) "% Used"
FROM dba_free_space fs,
(SELECT tablespace_name,SUM(bytes) bytes
FROM dba_data_files
GROUP BY tablespace_name) df
WHERE fs.tablespace_name (+) = df.tablespace_name
GROUP BY df.tablespace_name,df.bytes
UNION ALL
SELECT /* + RULE */ df.tablespace_name tspace,
fs.bytes / (1024 * 1024),
SUM(df.bytes_free) / (1024 * 1024),
Nvl(Round((SUM(fs.bytes) - df.bytes_used) * 100 / fs.bytes), 1),
Round((SUM(fs.bytes) - df.bytes_free) * 100 / fs.bytes)
FROM dba_temp_files fs,
(SELECT tablespace_name,bytes_free,bytes_used
FROM v$temp_space_header
GROUP BY tablespace_name,bytes_free,bytes_used) df
WHERE fs.tablespace_name (+) = df.tablespace_name
GROUP BY df.tablespace_name,fs.bytes,df.bytes_free,df.bytes_used
ORDER BY 4 DESC;
Sample output:
Note: Least free % tablespace will 1st in output. Also it include temp tablespace/s.