Split a *.gz file and merge again in Linux or Windows.

This post will deal the situation where you have big size of dump of anything and you need to split that into smaller chunks than need to send over ftp/mail etc. After that need to regenerate the same it was before splitting.

Situation: I have a expdp dump of 35 GB, I need to send it via ftp mail which can accept maximum 1 GB file.

Solution:

NOTE: With below command you can expdp without sysdba pwd.

expdp \"/ as sysdba\" FLASHBACK_TIME=\"TO_TIMESTAMP\(TO_CHAR\(SYSDATE,\'YYYY-MM-DD HH24:MI:SS\'\),\'YYYY-MM-DD HH24:MI:SS\'\)\" full=y dumpfile=full_db.dmp logfile=full_db.log DIRECTORY=DATAPUMP_DIR compression=METADATA_ONLY version=latest PARALLEL=4

NOTE: Another way to expdp without password is as under.

expdp \'/ as sysdba\' directory=DATAPUMP_DIR full=y ...

1. Zip the existing dump.
gzip full_db.dmp

2. Split the .gz file into 1 GB files.
split -b 1024m “full_db.dmp.gz” “full_db.dmp.gz_01”

3. Send it using appropriate method like ftp, attachement etc.
ftp/mail etc.

4. Merge splitted files again
Linux: cat full_db.dmp.gz_01a* > full_db.dmp.gz
Windows: copy /b file1 + file2 + file3 + file4 filetogether

5. Unzip the file and now you are ready to do everything on this file, as it was in step 1.
Now unzip the compressed dump and it is ready to use.
gunzip full_db.dmp.gz

Solaris and AIX: prtconf command

prtconf command for Aix and Solaris operating systems.

It provide the information about below ones:

System model.
Machine serial number.
Processor type, number of processors and clock speed of processors.
Network information.
File system information.
Paging space information.
Devices information.
Total memory size.
To Gather General Machine Information

Using the command prtconf alone provides the whole information of machine.
The sample is given below. Some actual values have been replaced with other values for the sake of security.

ask-sanjay10: $ prtconf

To know what is the LPAR partition number and partition name use -L.

ask-sanjay10: $ prtconf -L

If its not LPAR, then “-1 NULL” will be returned.

To know the physical memory size of the machine use -m flag.
ask-sanjay10: $ prtconf -m

To know the Vital Product Data of all physical devices internal or attached to the machine, use -v option.
ask-sanjay10: $prtconf -v

Almost all of the information gathered by above commands is sn above in the output of prtconf command.

To Get The Processor Clock Speed

For this issue the command with -s parameter.
ask-sanjay10: $ prtconf -s

To Get CPU Type

To know if the cpu type is 32 bit or 64 bit, issue the command with -c parameter.
ask-sanjay10: $ prtconf -c

To Know The Type of Kenel bits
ask-sanjay10: $ prtconf -k

Unix: Performance commands at O.S.

Performance related commands iostat , vmstat

Introduction to iostat , vmstat and netstat

This document is primarily written with reference to solaris performance monitoring and tuning but these tools are available in other unix variants also with slight syntax difference.

iostat , vmstat and netstat are three most commonly used tools for performance monitoring . These comes built in with the operating system and are easy to use .iostat stands for input output statistics and reports statistics for i/o devices such as disk drives . vmstat gives the statistics for virtual Memory and netstat gives the network statstics .

Following paragraphs describes these tools and their usage for performance monitoring.

Table of content :
1. Iostat
* Syntax
* example
* Result and Solutions

2. vmstat
* syntax
* example
* Result and Solutions

3. netstat
* syntax
* example
* Result and Solutions

Input Output statistics ( iostat )

iostat reports terminal and disk I/O activity and CPU utilization. The first line of output is for the time period since boot & each subsequent line is for the prior interval . Kernel maintains a number of counters to keep track of the values.

iostat’s activity class options default to tdc (terminal, disk, and CPU). If any other option/s are specified, this default is completely overridden i.e. iostat -d will report only statistics about the disks.

syntax:
Basic synctax is iostat interval count
option – let you specify the device for which information is needed like disk , cpu or terminal. (-d , -c , -t or -tdc ) . x options gives the extended statistics .

interval – is time period in seconds between two samples . iostat 4 will give data at each 4 seconds interval.

count – is the number of times the data is needed . iostat 4 5 will give data at 4 seconds interval 5 times

Example
$ iostat -xtc 10 5

extended disk statistics tty cpu
disk r/s w/s Kr/s Kw/s wait actv svc_t %w %b tin tout us sy wt id
sd0 2.6 3.0 20.7 22.7 0.1 0.2 59.2 6 19 0 84 3 85 11 0
sd1 4.2 1.0 33.5 8.0 0.0 0.2 47.2 2 23
sd2 0.0 0.0 0.0 0.0 0.0 0.0 0.0 0 0
sd3 10.2 1.6 51.4 12.8 0.1 0.3 31.2 3 31

The fields have the following meanings:
disk name of the disk
r/s reads per second
w/s writes per second
Kr/s kilobytes read per second
Kw/s kilobytes written per second
wait average number of transactions waiting for service (Q length)
actv average number of transactions actively being serviced
(removed from the queue but not yet completed)
%w percent of time there are transactions waiting
for service (queue non-empty)
%b percent of time the disk is busy (transactions
in progress)
Results and Solutions
The values to look from the iostat output are:
* Reads/writes per second (r/s , w/s)
* Percentage busy (%b)
* Service time (svc_t)

If a disk shows consistently high reads/writes along with , the percentage busy (%b) of the disks is greater than 5 percent, and the average service time (svc_t) is greater than 30 milliseconds, then one of the following action needs to be taken

1.) Tune the application to use disk i/o more efficiently by modifying the disk queries and using available cache facilities of application servers .

2.) Spread the file system of the disk on to two or more disk using disk striping feature of volume manager /disksuite etc.

3.) Increase the system parameter values for inode cache , ufs_ninode , which is Number of inodes to be held in memory. Inodes are cached globally (for UFS), not on a per-file system basis

4.) Move the file system to another faster disk /controller or replace existing disk/controller to a faster one.
Virtual Memory Statistics ( vmstat )

vmstat

vmstat reports virtual memory statistics of process, virtual memory, disk, trap, and CPU activity.

On multicpu systems , vmstat averages the number of CPUs into the output. For per-process statistics .Without options, vmstat displays a one-line summary of the virtual memory activity since the system was booted.

syntax
Basic synctax is vmstat interval count

option – let you specify the type of information needed such as paging -p , cache -c ,.interrupt -i etc.

if no option is specified information about process , memory , paging , disk ,interrupts & cpu is displayed .

interval – is time period in seconds between two samples . vmstat 4 will give data at each 4 seconds interval.

count – is the number of times the data is needed . vmstat 4 5 will give data at 4 seconds interval 5 times.

Example
The following command displays a summary of what the system
is doing every five seconds.

# vmstat 5

procs memory page disk faults cpu
r b w swap free re mf pi p fr de sr s0 s1 s2 s3 in sy cs us sy id
0 0 0 11456 4120 1 41 19 1 3 0 2 0 4 0 0 48 112 130 4 14 82
0 0 1 10132 4280 0 4 44 0 0 0 0 0 23 0 0 211 230 144 3 35 62
0 0 1 10132 4616 0 0 20 0 0 0 0 0 19 0 0 150 172 146 3 33 64
0 0 1 10132 5292 0 0 9 0 0 0 0 0 21 0 0 165 105 130 1 21 78

The fields of vmstat’s display are
procs
r in run queue
b blocked for resources I/O, paging etc.
w swapped
memory (in Kbytes)
swap – amount of swap space currently available
free – size of the free list

page ( in units per second).
re page reclaims – see -S option for how this
field is modified.
mf minor faults – see -S option for how this
field is modified.
pi kilobytes paged in
po kilobytes paged out
fr kilobytes freed
de anticipated short-term memory shortfall (Kbytes)
sr pages scanned by clock algorithm
disk ( operations per second )
There are slots for up to four disks,
labeled with a single letter and number.
The letter indicates the type of disk
(s = SCSI, i = IPI, etc).
The number is the logical unit number.

faults
in (non clock) device interrupts
sy system calls
cs CPU context switches

cpu – breakdown of percentage usage of CPU time.
On multiprocessors this is an a
average across all processors.
us user time
sy system time
id idle time
Results and Solution from iostat

A. CPU issues
Following columns has to be watched to determine if there is any cpu issue

1. Processes in the run queue (procs r)
2. User time (cpu us)
3. System time (cpu sy)
4. Idle time (cpu id)

procs cpu
r b w us sy id
0 0 0 4 14 82
0 0 1 3 35 62
0 0 1 3 33 64
0 0 1 1 21 78
Problem symptoms

A.) Number of processes in run queue
1.) If the number of processes in run queue (procs r) are consistently greater than the number of CPUs on the system it will slow down system as there are more processes then available CPUs .
2.) if this number is more than four times the number of available CPUs in the system then system is facing shortage of cpu power and will greatly slow down the processess on the system.
3.) If the idle time (cpu id) is consistently 0 and if the system time (cpu sy) is double the user time (cpu us) system is facing shortage of CPU resources.

Resolution
Resolution to these kind of issues involves tuning of application procedures to make efficient use of cpu and as a last resort increasing the cpu power or adding more cpu to the system.

B. Memory Issues
Memory bottlenecks are determined by the scan rate (sr) . The scan rate is the pages scanned by the clock algorithm per second. If the scan rate (sr) is continuously over 200 pages per second then there is a memory shortage.

Resolution
1. Tune the applications & servers to make efficient use of memory and cache.
2. Increase system memory .
3. Implement priority paging in s in pre solaris 8 versions by adding line “set priority paging=1? in
/etc/system. Remove this line if upgrading from Solaris 7 to 8 & retaining old /etc/system file.

Unix: Network Statistics (netstat)

Network Statistics (netstat)

netstat displays the contents of various network-related data structures in depending on the options selected.

Syntax

netstat
multiple options can be given at one time.

Options
-a – displays the state of all sockets.
-r – shows the system routing tables
-i – gives statistics on a per-interface basis.
-m – displays information from the network memory buffers. On Solaris, this shows statistics for STREAMS
-p [proto] – retrieves statistics for the specified protocol
-s – shows per-protocol statistics. (some implementations allow -ss to remove fileds with a value of 0 (zero) from the display.)
-D – display the status of DHCP configured interfaces.
-n do not lookup hostnames, display only IP addresses.
-d (with -i) displays dropped packets per interface.
-I [interface] retrieve information about only the specified interface.
-v be verbose

interval – number for continuous display of statictics.

Example

$netstat -rn

Routing Table: IPv4
Destination Gateway Flags Ref Use Interface
——————– ——————– —– —– —— ———
192.168.1.0 192.168.1.11 U 1 1444 le0
224.0.0.0 192.168.1.11 U 1 0 le0
default 192.168.1.1 UG 1 68276
127.0.0.1 127.0.0.1 UH 1 10497 lo0
This shows the output on a Solaris machine who’s IP address is 192.168.1.11 with a default router at 192.168.1.1

Results and Solutions

A.) Network availability
The command as above is mostly useful in troubleshooting network accessibility issues . When outside network is not accessible from a machine check the following

1. if the default router ip address is correct
2. you can ping it from your machine.
3. If router address is incorrect it can be changed with route add command. See man route for more information.

route command examples
$route add default
$route add 192.0.2.32

If the router address is correct but still you can’t ping it there may be some network cable /hub/switch problem and you have to try and eliminate the faulty component .

B.) Network Response
$ netstat -i

Name Mtu Net/Dest Address Ipkts Ierrs Opkts Oerrs Collis Queue
lo0 8232 loopback localhost 77814 0 77814 0 0 0
hme0 1500 server1 server1 10658 3 48325 0 279257 0
This option is used to diagnose the network problems when the connectivity is there but it is slow in response .

Values to look at:

* Collisions (Collis)
* Output packets (Opkts)
* Input errors (Ierrs)
* Input packets (Ipkts)

The above values will give information to workout

i. Network collision rate as follows :

Network collision rate = Output collision counts / Output packets

Network-wide collision rate greater than 10 percent will indicate

* Overloaded network,
* Poorly configured network,
* Hardware problems.

ii. Input packet error rate as follows :

Input Packet Error Rate = Ierrs / Ipkts.

If the input error rate is high (over 0.25 percent), the host is dropping packets. Hub/switch cables etc needs to be checked for potential problems.

C. Network socket & TCP Connection state

Netstat gives important information about network socket and tcp state . This is very useful in
finding out the open , closed and waiting network tcp connection .

Network states returned by netstat are following

CLOSED —- Closed. The socket is not being used.
LISTEN —- Listening for incoming connections.
SYN_SENT —- Actively trying to establish connection.
SYN_RECEIVED —- Initial synchronization of the connection under way.
ESTABLISHED —- Connection has been established.
CLOSE_WAIT —- Remote shut down; waiting for the socket to close.
FIN_WAIT_1 —- Socket closed; shutting down connection.
CLOSING —- Closed,
then remote shutdown; awaiting acknowledgement.
LAST_ACK —- Remote shut down, then closed ;awaiting acknowledgement.
FIN_WAIT_2 —- Socket closed; waiting for shutdown from remote.
TIME_WAIT —- Wait after close for remote shutdown retransmission..
Example
#netstat -a

Local Address Remote Address Swind Send-Q Rwind Recv-Q State
*.* *.* 0 0 24576 0 IDLE
*.22 *.* 0 0 24576 0 LISTEN
*.* *.* 0 0 24576 0 IDLE
*.32771 *.* 0 0 24576 0 LISTEN
*.4045 *.* 0 0 24576 0 LISTEN
*.25 *.* 0 0 24576 0 LISTEN
*.5987 *.* 0 0 24576 0 LISTEN
*.898 *.* 0 0 24576 0 LISTEN
*.32772 *.* 0 0 24576 0 LISTEN
*.32775 *.* 0 0 24576 0 LISTEN
*.32776 *.* 0 0 24576 0 LISTEN
*.* *.* 0 0 24576 0 IDLE
192.168.1.184.22 192.168.1.186.50457 41992 0 24616 0 ESTABLISHED
192.168.1.184.22 192.168.1.186.56806 38912 0 24616 0 ESTABLISHED
192.168.1.184.22 192.168.1.183.58672 18048 0 24616 0 ESTABLISHED
if you see a lots of connections in FIN_WAIT state tcp/ip parameters have to be tuned because the
connections are not being closed and they gets accumulating . After some time system may run out of
resource . TCP parameter can be tuned to define a time out so that connections can be released and used by new connection.

Windows commands in nutshell

Here is the quick summary and few commands are in details:

1. nslookup
The nslookup tool can help you to verify that DNS name resolution is working correctly. When you run nslookup against a host name, the tool will show you how the name was resolved, as well as which DNS server was used during the lookup. This tool can be extremely helpful when troubleshooting problems related to legacy DNS records that still exist but that are no longer correct.
To use this tool, just enter the nslookup command, followed by the name of the host you want to resolve. For example:
C:\Users\Sanjay.Kumar>nslookup ask-sanjay.com
Server: vsresolverdns.atl3.dc.sita.aero
Address: 10.213.200.50
Non-authoritative answer:
Name: ask-sanjay.com
Address: 103.247.96.231
C:\Users\Sanjay.Kumar>
2. ping
Ping is probably the simplest of all diagnostic commands. It’s used to verify basic TCP/IP connectivity to a network host. To use it, simply enter the command, followed by the name or IP address of the host you want to test. For example:
Keep in mind that this command will work only if Internet Control Message Protocol (ICMP) traffic is allowed to pass between the two machines. If at any point a firewall is blocking ICMP traffic, the ping will fail.

C:\Users\Sanjay.Kumar>ping ask-sanjay.com
Pinging ask-sanjay.com [103.247.96.231] with 32 bytes of data:
Reply from 103.247.96.231: bytes=32 time=141ms TTL=44
Reply from 103.247.96.231: bytes=32 time=162ms TTL=44
Reply from 103.247.96.231: bytes=32 time=176ms TTL=44
Reply from 103.247.96.231: bytes=32 time=195ms TTL=44

Ping statistics for 103.247.96.231:
Packets: Sent = 4, Received = 4, Lost = 0 (0% loss),
Approximate round trip times in milli-seconds:
Minimum = 141ms, Maximum = 195ms, Average = 168ms
3. tasklist
The tasklist command is designed to provide information about the tasks that are running on a Windows 7 system. At its most basic, you can enter the following command:
tasklist
The tasklist command has numerous option. One is the -m switch, which causes tasklist to display all the DLL modules associated with a task. The other is the -svc switch, which lists the services that support each task. Here’s how they look:
tasklist -m
tasklist -svc
4. taskkill
The taskkill command terminates a task, either by name (which is referred to as the image name) or by process ID. You can follow the taskkill command with -pid (process ID) or image nameand the name or process ID of the task that you want to terminate. Here are two examples of how this command works:
taskkill -pid 4934
taskkill -im iexplore.exe

5. telnet
Telnet ask-sanjay.com
NOTE: If telnet package is not installed on your system. You can install it by using below command
pkgmgr /iu:”TelnetClient”

NOTE: You may need to restart cmd to get it into affect.

6. tnsping
tnsping <service_name_having_entry_in_your_tnsnames.ora>
Used TNSNAMES adapter to resolve the alias
Attempting to contact (DESCRIPTION = (ADDRESS = (PROTOCOL = TCP)(HOST = hostname)(PORT = 1521)) (CONNECT_DATA = (SERVER = DEDICATED) (SERVICE_NAME = Name_of_Service)))
OK (1050 msec)

C:\Users\Sanjay.Kumar>
C:\Users\Sanjay.Kumar>tnsping v_ref_vsvxs1d

TNS Ping Utility for 64-bit Windows: Version 11.1.0.7.0 – Production on 01-FEB-2013 10:43:09

Copyright (c) 1997, 2008, Oracle. All rights reserved.

Used parameter files:
C:\app\sanjay.kumar\product\11.1.0\db_1\network\admin\sqlnet.ora

C:\Users\Sanjay.Kumar>help
For more information on a specific command, type HELP command-name
ASSOC                            Displays or modifies file extension associations.
ATTRIB                         Displays or changes file attributes.
BREAK                           Sets or clears extended CTRL+C checking.
BCDEDIT                       Sets properties in boot database to control boot loading.
CACLS                            Displays or modifies access control lists (ACLs) of files.
CALL                              Calls one batch program from another.
CD                                   Displays the name of or changes the current directory.
CHCP                             Displays or sets the active code page number.
CHDIR                          Displays the name of or changes the current directory.
CHKDSK                       Checks a disk and displays a status report.
CHKNTFS                    Displays or modifies the checking of disk at boot time.
CLS                                Clears the screen.
CMD                              Starts a new instance of the Windows command interpreter.
COLOR                          Sets the default console foreground and background colors.
COMP                            Compares the contents of two files or sets of files.
COMPACT                    Displays or alters the compression of files on NTFS partitions.
CONVERT                    Converts FAT volumes to NTFS. You cannot convert thecurrent drive.
COPY                             Copies one or more files to another location.
DATE                             Displays or sets the date.
DEL                                 Deletes one or more files.
DIR                                 Displays a list of files and subdirectories in a directory.
DISKCOMP                  Compares the contents of two floppy disks.
DISKCOPY                   Copies the contents of one floppy disk to another.
DISKPART                   Displays or configures Disk Partition properties.
DOSKEY                        Edits command lines, recalls Windows commands, and creates macros.
DRIVERQUERY         Displays current device driver status and properties.
ECHO                             Displays messages, or turns command echoing on or off.
ENDLOCAL                  Ends localization of environment changes in a batch file.
ERASE                           Deletes one or more files.
EXIT                               Quits the CMD.EXE program (command interpreter).
FC                                    Compares two files or sets of files, and displays the differences between them.
FIND                              Searches for a text string in a file or files.
FINDSTR                      Searches for strings in files.
FOR                                Runs a specified command for each file in a set of files.
FORMAT                      Formats a disk for use with Windows.
FSUTIL                        Displays or configures the file system properties.
FTYPE                          Displays or modifies file types used in file extension associations.
GOTO                           Directs the Windows command interpreter to a labeled line in a batch program.
GPRESULT                Displays Group Policy information for machine or user.
GRAFTABL               Enables Windows to display an extended character set in graphics mode.
HELP                           Provides Help information for Windows commands.
ICACLS                       Display, modify, backup, or restore ACLs for files and directories.
IF                                  Performs conditional processing in batch programs.
LABEL                        Creates, changes, or deletes the volume label of a disk.
MD                               Creates a directory.
MKDIR                       Creates a directory.
MKLINK                    Creates Symbolic Links and Hard Links
MODE                         Configures a system device.
MORE                         Displays output one screen at a time.
MOVE                         Moves one or more files from one directory to another directory.
OPENFILES              Displays files opened by remote users for a file share.
PATH                          Displays or sets a search path for executable files.
PAUSE                        Suspends processing of a batch file and displays a message.
POPD                           Restores the previous value of the current directory saved by PUSHD.
PRINT                        Prints a text file.
PROMPT                    Changes the Windows command prompt.
PUSHD                       Saves the current directory then changes it.
RD                                Removes a directory.
RECOVER                 Recovers readable information from a bad or defective disk.
REM                            Records comments (remarks) in batch files or CONFIG.SYS.
REN                             Renames a file or files.
RENAME                   Renames a file or files.
REPLACE                  Replaces files.
RMDIR                       Removes a directory.
ROBOCOPY              Advanced utility to copy files and directory trees
SET                             Displays, sets, or removes Windows environment variables.
SETLOCAL               Begins localization of environment changes in a batch file.
SC                               Displays or configures services (background processes).
SCHTASKS             Schedules commands and programs to run on a computer.
SHIFT                      Shifts the position of replaceable parameters in batch files.
SHUTDOWN          Allows proper local or remote shutdown of machine.
SORT                        Sorts input.
START                     Starts a separate window to run a specified program or command.
SUBST                     Associates a path with a drive letter.
SYSTEMINFO     Displays machine specific properties and configuration.
TASKLIST            Displays all currently running tasks including services.
TASKKILL           Kill or stop a running process or application.
TIME                     Displays or sets the system time.
TITLE                   Sets the window title for a CMD.EXE session.
TREE                     Graphically displays the directory structure of a drive or path.
TYPE                     Displays the contents of a text file.
VER                        Displays the Windows version.
VERIFY               Tells Windows whether to verify that your files are written correctly to a disk.
VOL                       Displays a disk volume label and serial number.
XCOPY                 Copies files and directory trees.
WMIC                  Displays WMI information inside interactive command shell.
For more information on tools see the command-line reference in the online help.

Here is the list full list from microsoft 

RAC: List all locked objects for all instances in RAC

 
SET LINESIZE 230
SET PAGESIZE 300
SET VERIFY OFF
COLUMN owner FORMAT A20
COLUMN username FORMAT A20
COLUMN object_owner FORMAT A20
COLUMN object_name FORMAT A30
COLUMN locked_mode FORMAT A15
SELECT b.inst_id,
b.session_id AS sid,
NVL(b.oracle_username, '(oracle)') AS username,
a.owner AS object_owner,
a.object_name,
Decode(b.locked_mode, 0, 'None',
1, 'Null (NULL)',
2, 'Row-S (SS)',
3, 'Row-X (SX)',
4, 'Share (S)',
5, 'S/Row-X (SSX)',
6, 'Exclusive (X)',
b.locked_mode) locked_mode,
b.os_user_name
FROM dba_objects a, gv$locked_object b
WHERE a.object_id = b.object_id
ORDER BY 1, 2, 3, 4; Sample output:

Script which will generate the alter session kill command:
select blocking_session,blocked_session,script from 
( select distinct
s1.username || '@' || s1.machine || ' ( INST=' || s1.inst_id || ' SID=' || s1.sid || ' ET=' || s1.last_call_et || 'sn. STATUS=' || s1.status || ' EVENT=' || s1.event || ' ACTION= ' || s1.action || ' PROGRAM=' || s1.program || ' MODULE=' || s1.module || ')' blocking_session,
s2.username || '@' || s2.machine || ' ( INST=' || s2.inst_id || ' SID=' || s2.sid || ' ET=' || s2.last_call_et || 'sn. STATUS=' || s2.status || ' EVENT=' || s2.event || ' ACTION= ' || s2.action || ' PROGRAM=' || s2.program || ' MODULE=' || s2.module || ')' blocked_session,
decode(s1.type,'USER','alter system kill session ''' || s1.sid || ',' || s1.serial# || ',@' || s1.inst_id || ''' immediate;' ,null)
script ,
count(*) over (partition by s1.inst_id,s1.sid) blocked_cnt
from gv$lock l1, gv$session s1, gv$lock l2, gv$session s2
where s1.sid=l1.sid and s2.sid=l2.sid
and s1.inst_id=l1.inst_id and s2.inst_id=l2.inst_id
and l1.block > 0 and l2.request > 0
and l1.id1 = l2.id1 and l1.id2 = l2.id2 )
order by blocked_cnt desc;

Finding the SQL_id with other details about the blocking sessions.

 set lines 1234 pages 9999
col inst_id for a10
col serial# for a10
col machine for a30
col username for a10
col event for a20
col blocking_session for 999999
col blocking_instance for 999999
col status for a10
col INST_ID for 9999
col SERIAL# for 999999
select inst_id,sid,serial#, machine, username, event, blocking_session, blocking_instance, status, sql_id
from gv$session where status ='ACTIVE'and username is not null and username!='SYS';

DB Admin: Tablesapces size(MB), free(MB) % used and %free

set pagesize 150
SELECT /* + RULE */ df.tablespace_name "Tablespace",
df.bytes / (1024 * 1024) "Size (MB)",
SUM(fs.bytes) / (1024 * 1024) "Free (MB)",
Nvl(Round(SUM(fs.bytes) * 100 / df.bytes),1) "% Free",
Round((df.bytes - SUM(fs.bytes)) * 100 / df.bytes) "% Used"
FROM dba_free_space fs,
(SELECT tablespace_name,SUM(bytes) bytes
FROM dba_data_files
GROUP BY tablespace_name) df
WHERE fs.tablespace_name (+) = df.tablespace_name
GROUP BY df.tablespace_name,df.bytes
UNION ALL
SELECT /* + RULE */ df.tablespace_name tspace,
fs.bytes / (1024 * 1024),
SUM(df.bytes_free) / (1024 * 1024),
Nvl(Round((SUM(fs.bytes) - df.bytes_used) * 100 / fs.bytes), 1),
Round((SUM(fs.bytes) - df.bytes_free) * 100 / fs.bytes)
FROM dba_temp_files fs,
(SELECT tablespace_name,bytes_free,bytes_used
FROM v$temp_space_header
GROUP BY tablespace_name,bytes_free,bytes_used) df
WHERE fs.tablespace_name (+) = df.tablespace_name
GROUP BY df.tablespace_name,fs.bytes,df.bytes_free,df.bytes_used
ORDER BY 4 DESC;

Sample output: 

Note: Least free % tablespace will 1st in output. Also it include temp tablespace/s.

DB Admin: Database size in GBs

 
SET SERVEROUTPUT ON
declare
total_size_b number;
tfree_size_b number;
tused_size_b number;
begin
dbms_output.enable(100000);
select Sum(bytes) into total_size_b
from dba_data_files;
select Sum(bytes) into tfree_size_b
from dba_free_space;
select Sum(bytes) into tused_size_b
from dba_segments;
dbms_output.put_line('Total:' || TO_CHAR(Round(total_size_b/1024/1024/1024, 2), '999,999.00') || ' GB');
dbms_output.put_line('Free: ' || TO_CHAR(Round(tfree_size_b/1024/1024/1024, 2), '999,999.00') || ' GB');
dbms_output.put_line('Used: ' || TO_CHAR(Round(tused_size_b/1024/1024/1024, 2), '999,999.00') || ' GB');
end;
/
SET SERVEROUTPUT ON

Sample output:

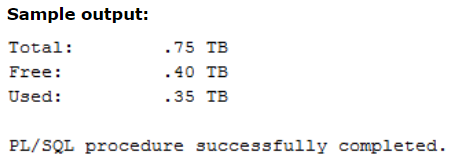
DB Admin: Database size in TBs

SET SERVEROUTPUT ON
declare
total_size_b number;
tfree_size_b number;
tused_size_b number;
begin
dbms_output.enable(100000);
select
Sum(bytes) into total_size_b
from
dba_data_files;
select
Sum(bytes) into tfree_size_b
from
dba_free_space;
select
Sum(bytes) into tused_size_b
from
dba_segments;
dbms_output.put_line('Total:' || TO_CHAR(Round(total_size_b/1024/1024/1024/1024, 2), '999,999.00') || ' TB');
dbms_output.put_line('Free: ' || TO_CHAR(Round(tfree_size_b/1024/1024/1024/1024, 2), '999,999.00') || ' TB');
dbms_output.put_line('Used: ' || TO_CHAR(Round(tused_size_b/1024/1024/1024/1024, 2), '999,999.00') || ' TB');
end;
/
SET SERVEROUTPUT OFF

How to install Docker on AWS EC2 machine

Docker is a very useful tool when it comes to create your applications, deploy and run them by using containers. In SDLC its utilization comes in the Deployment stage. Please follow the steps below to install and use Docker on your AWS EC2 machine.

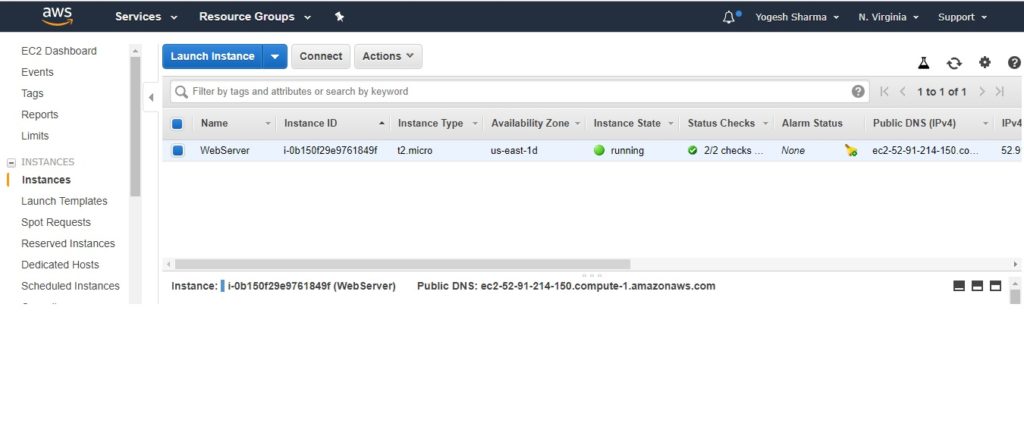
  1. Launch an EC2 instance in your AWS account. Please remember the region you are launching the instance as the services of the tool installed will be available in this region only.

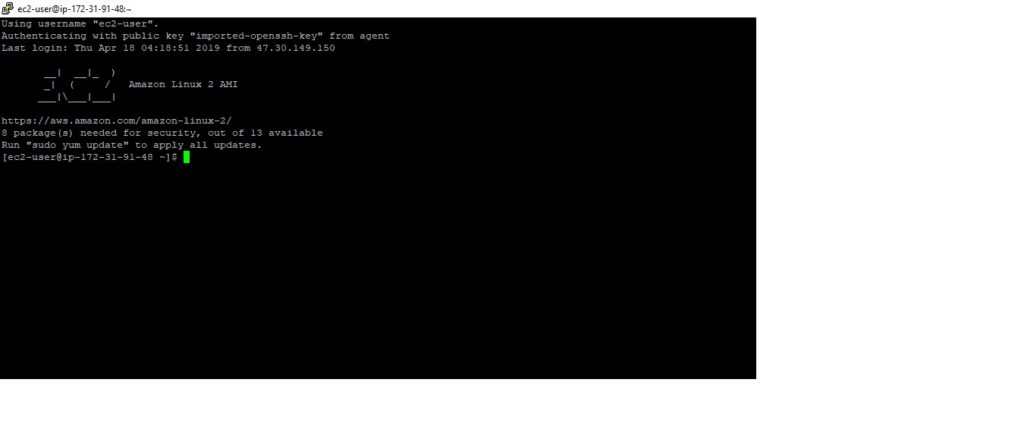
2. Connect to the SSH client where we can run the commands to configure Docker and use it.

Please follow the below steps to install docker on your AWS AMI machine.

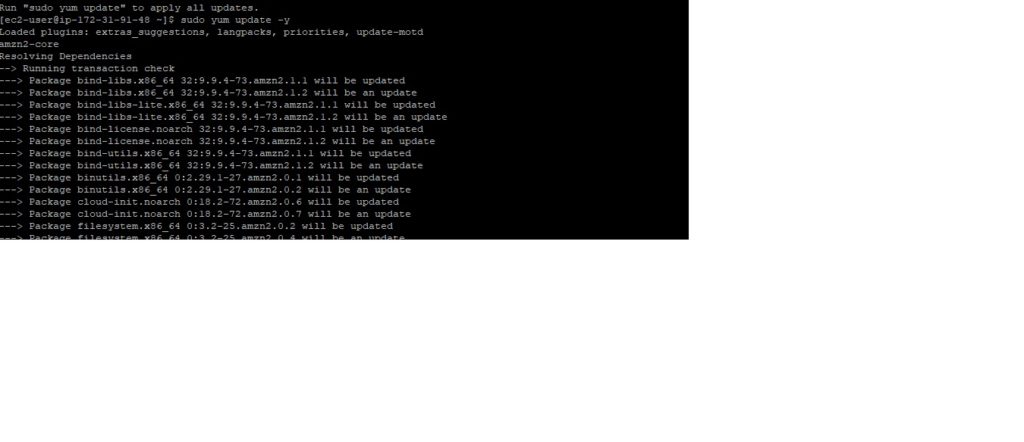
3. Update the installed packages and package cache on your ec2 instance by running below command.

sudo yum update -y

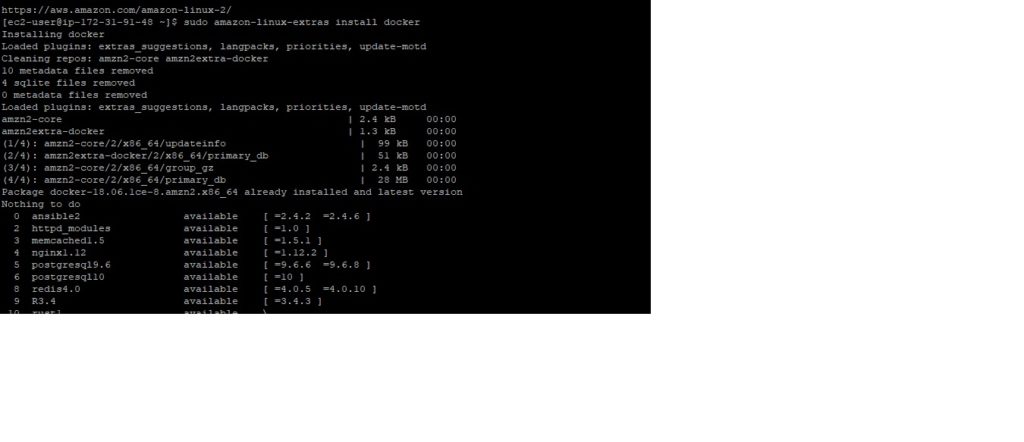
4. Then to Install the latest Docker Community Edition package. Execute below command in your AWS Linux instance.

sudo amazon-linux-extras install docker or sudo yum install docker

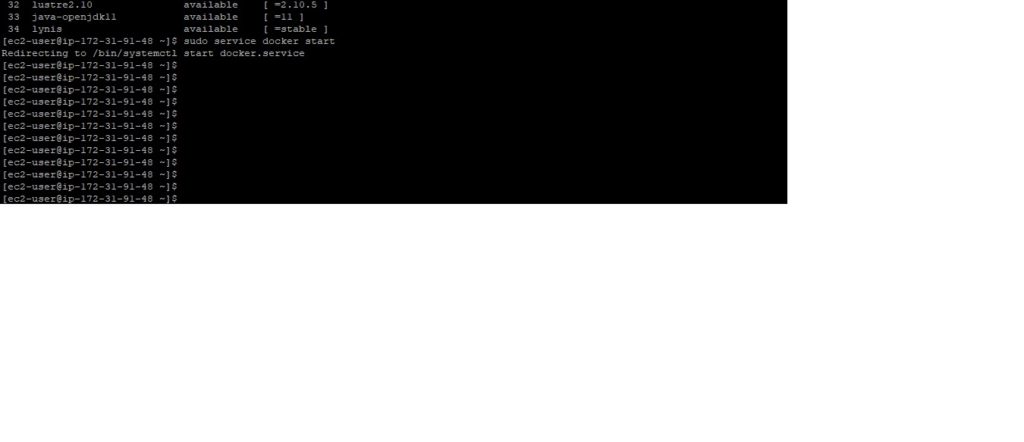
5. To start the docker services execute the command below in your AWS Linux instance.

sudo service docker start

6. If you want to use the docker commands without using Sudo then Add the ec2-user to the docker group. Execute below command.

sudo usermod -a -G docker ec2-user

7. Now as docker is installed to use the Docker services, please once disconnect from your SSH client and connect again, to activate all the required Docker permissions.

8. To Verify If we can run the docker command without use of Sudo keyword, run the below command.


docker info

Now the Docker tool is ready to create Images and Containers. For more information on how to create Images and containers in Docker please refer our article “To create images and containers using Docker on AWS”.